Which social media metrics belong in a report, and which do not
Every tool offers a hundred social media metrics and three matter. Volume, impressions, unique accounts and concentration, plus the two ratios that earn their place.
Every tool offers a hundred social media metrics and almost nobody can say which three actually matter. The list grows because adding a number is easy and removing one requires an argument.
This is the short version of that argument.
Tell us what decision you need to support and we will tell you which figures answer it, before you commit to anything.
Tell us what decision you need to support
Which social media metrics belong on the first page
Four, and they always answer in the same order: how much was said, how many times it was seen, how many people took part, and how concentrated it was. Volume, impressions, unique accounts and concentration. Anything that does not support one of those four belongs further down, in the appendix where evidence lives.
Why volume is the weakest of the four
Volume is the easiest number to produce and the easiest to misread. It counts posts, which means it counts a thousand reposts of one message exactly the same as a thousand people each writing their own.
Strip the reposts and a conversation frequently collapses to a handful of original posts. That collapse is not a failure of the measurement, it is the measurement working. Report both figures and the difference between them tells you whether something spread or was simply repeated.
What impressions add that volume cannot
Impressions count how many times posts appeared on a screen, and on X that figure comes from the platform rather than from a model. It is the closest thing in social reporting to a counted number.
Put it beside volume and the picture usually corrects itself. Ten thousand posts nobody saw is a smaller event than four hundred that reached the right audience, and only the impression figure makes that visible.
Why unique accounts is the reality check
Unique accounts answers how many separate people took part, which is the question most people think volume answers. The gap between the two is where inflated reporting hides. A campaign with 8,000 posts from 300 accounts is a different result from 8,000 posts by 6,000 accounts. The first is a small group being loud. The second is a real audience, and they call for different follow-ups.
Concentration, the metric almost no report includes
Concentration measures how much of the total a handful of posts or accounts carried. Work it out by sorting by impressions and accumulating until you reach half the total, then count how many rows it took.
If half the reach came from three posts, you know exactly what to amplify next time. If it took four hundred, no single action will move the needle and your strategy has to be different. Same campaign, opposite conclusions, and no other metric distinguishes them.
Ratios that earn their place
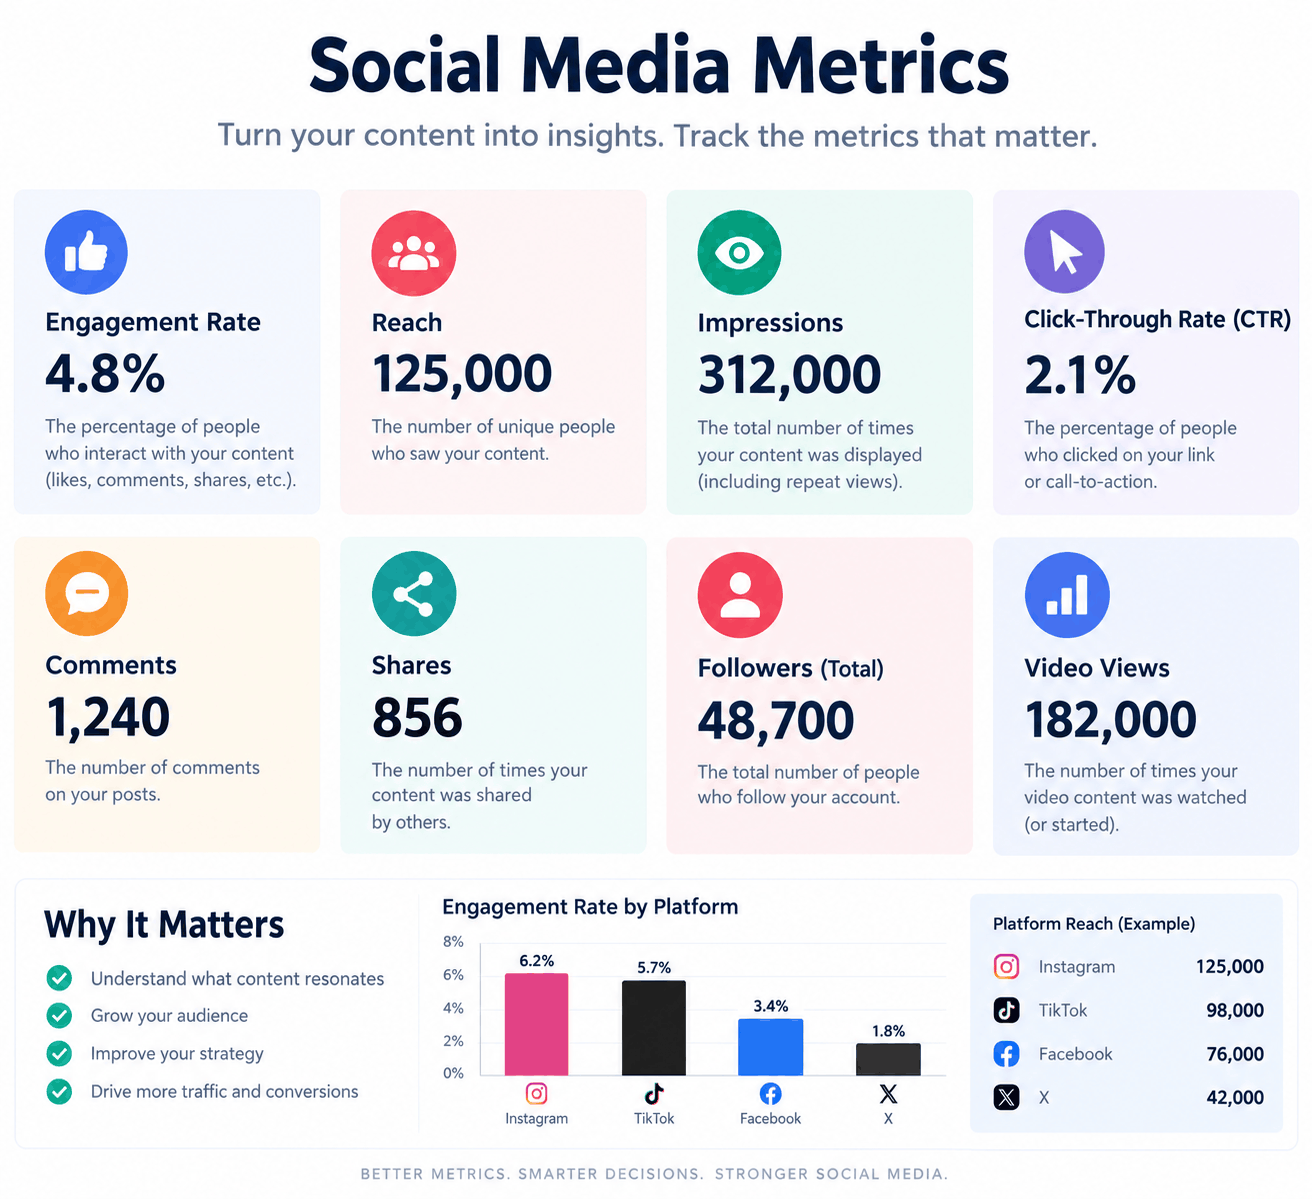
Two are worth reporting and the rest are noise. Engagement rate, which is interactions divided by impressions, says whether the people who saw something reacted. Impressions per post says whether each thing you publish is working harder or less hard than before.
Both are independent of how much you posted, which is what makes them comparable across months. Absolute totals rise simply by publishing more, and that has never been an improvement.
What to leave out of the report
Follower counts presented as reach, because they are a theoretical maximum that has never happened. Sentiment percentages with no stated method, because a word list breaks on irony and negation. And any metric that has never once changed a decision.
Cutting those three usually removes half the deck and none of the value. If a number has been in twelve monthly reports and nobody has ever asked about it, it is decoration.
How to keep metrics comparable over time
Write the query, the period and the decision about reposts at the bottom of every report. Four lines, and they are what makes next quarter comparable to this one. Without them, definitions drift, the trend line becomes fiction and a year of data turns into a year of anecdotes. It is the least interesting part of reporting and the one that decides whether any of it was worth collecting.
We deliver the report and the dataset behind it, gathered within the Twitter compliance rules, so every figure traces back to the posts it came from. Tell us what you need to measure and we will scope it around the question rather than the tool.