A peak or a plateau, and why the totals cannot tell you
The chart of posts by day is usually decoration. Its shape answers whether you bought a day of attention or built a week of it.
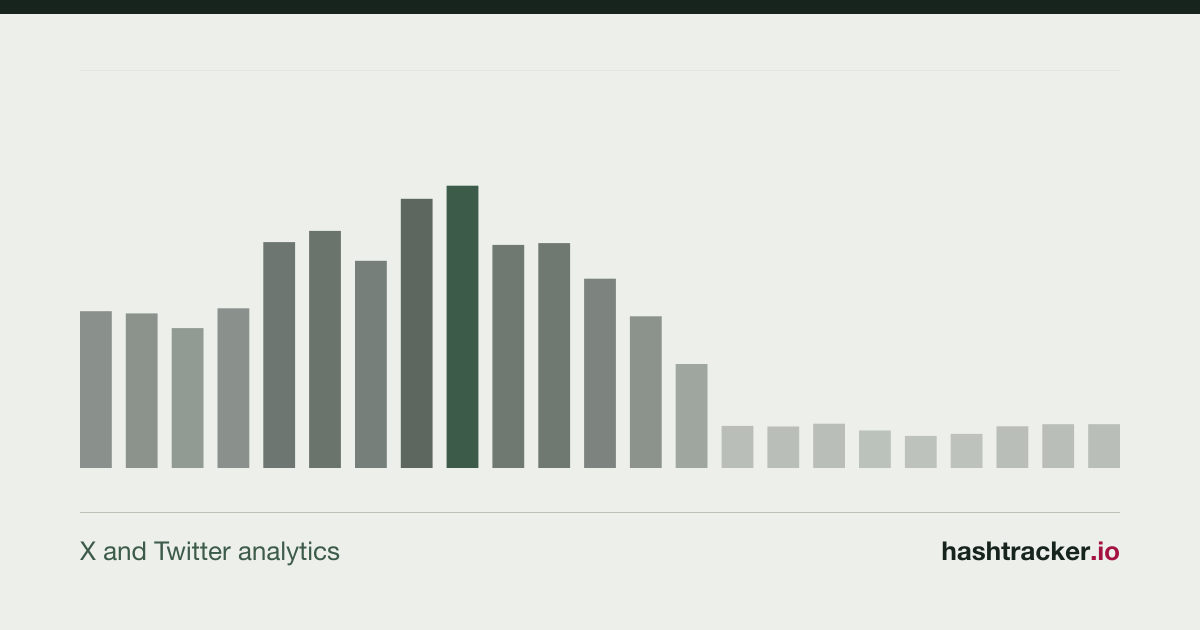
Every campaign report has a chart of posts by day, and most of them are decoration. The line goes up, somebody says the campaign worked, and the meeting moves on.
The chart is worth more than that. Its shape answers a question the totals cannot: whether you bought a day of attention or built a week of it.
A peak and a plateau are different products
A peak is one day, or a few hours, where almost everything happened. Launches do this. So do crises, and so does a single large account posting once.
A plateau is a conversation that stayed at a level for days. Sponsorships do this, as do long campaigns and subjects people genuinely argue about.
Neither is better. They are different outcomes and they need different follow-ups, and the total number of tweets is identical in both.
Read the line against what you did
Plot the posts by day, then mark your own actions on it. The launch post, the press release, the partner activation, the paid burst.
Where the line moves next to something you did, you have evidence. Where it moves with nothing next to it, something external happened and it is worth half an hour to find out what. That is usually where the real story of the month is.
See a timeline on a sample report
The two lines that should be compared
Posts by day says how much was written. Impressions by day says how much was seen. They come apart more often than people expect.
A day with few posts and enormous impressions means somebody large joined in. A day with many posts and flat impressions means a lot of accounts talking to nobody, which is what most hashtag campaigns look like from the inside.
If you only have room for one chart, use impressions. If you have room for two, put them one above the other on the same dates.
After the peak, the number that matters
Take the level the conversation sat at before the campaign and compare it with the level a week after the peak. That difference, not the height of the peak, is what the campaign left behind.
Most campaigns return to exactly where they started. Saying so out loud is more useful than a chart that ends on the best day.
The hour of the day is a working answer
The report gives the peak hour and the peak day of the week, and the grid of hour against weekday. It is the least glamorous part of a report and the one people act on most, because it turns into a posting schedule without any interpretation at all.
One caution worth writing down. Those hours are in UTC, so a conversation in Spain or Mexico needs converting before anybody builds a calendar on it.
We deliver the report and the rows behind it, gathered within the Twitter compliance rules, so any day on the chart can be opened and read. See the plans or tell us about the campaign.