What a social media report sample should actually contain
Most social media report sample files are layout. This is the structure underneath: period, query, three findings, comparisons, normalised rates and the dataset.
Searching for a social media report sample usually means one thing: a report is due and nobody agreed what goes in it. The templates you find are mostly layout, and layout is the easy part.
What follows is the structure underneath, section by section, with what each one has to contain to be worth reading.
Tell us what your report needs to cover and we will build it from the raw data.
Tell us what your report needs to cover
Start with the period and the query, not the numbers
The first page states the exact dates, the exact search that produced the data, and what was excluded. Reposts in or out. Which languages. Which accounts were treated as owned. Four lines, before anything else.
Skip this and every number afterwards is unverifiable, and the first person who tries to reproduce it will get something different.
The summary is three findings, not a list of totals
The summary says what changed and what to do about it, in three sentences a reader can repeat from memory. Not the totals, which are further down, and not everything you noticed, which is most of the value lost to volume.
If you cannot write three, write one. A report with a single sharp finding is read. A report with fourteen bullet points is scanned and forgotten, which is the same as not writing it.
Totals with a comparison, never alone
Every headline number needs the equivalent number from the previous period next to it. Mentions, reach, engagements, participating accounts. A figure on its own tells the reader nothing, because nobody carries last month's numbers in their head.
Give the change as a percentage and as an absolute. Going from 2 to 6 mentions is a 200% rise and it is also nothing, and only showing both makes that obvious.
Normalised rates, so output does not masquerade as performance
Impressions per post and engagements per post belong next to the totals. Volume rises when you post more, which is a fact about staffing rather than about the work. The pair is what makes a month legible. Totals up and rates flat means you posted more. Totals flat and rates up means the content got better. Those two months look identical on a volume chart and mean opposite things.
A section on what drove the period
Find the posts that carried the numbers, and there are usually fewer than ten. Name them, quote them, say who published them and how far they went. This is the only section anyone reads twice, and it is the one templates leave out because it cannot be automated. It is also what turns a report into something a reader can act on, since a decision needs a cause and a chart does not supply one.
One page per channel, at most
If the report covers more than one network, give each a page with the same six numbers in the same order. Same metrics, same period, same layout, every month. Comparability is worth more than completeness here. A reader who learns where to look on the Twitter page finds the same thing on the Instagram page, and that is what lets someone skim four channels in two minutes instead of reading four separate documents.
Detail tables and the dataset
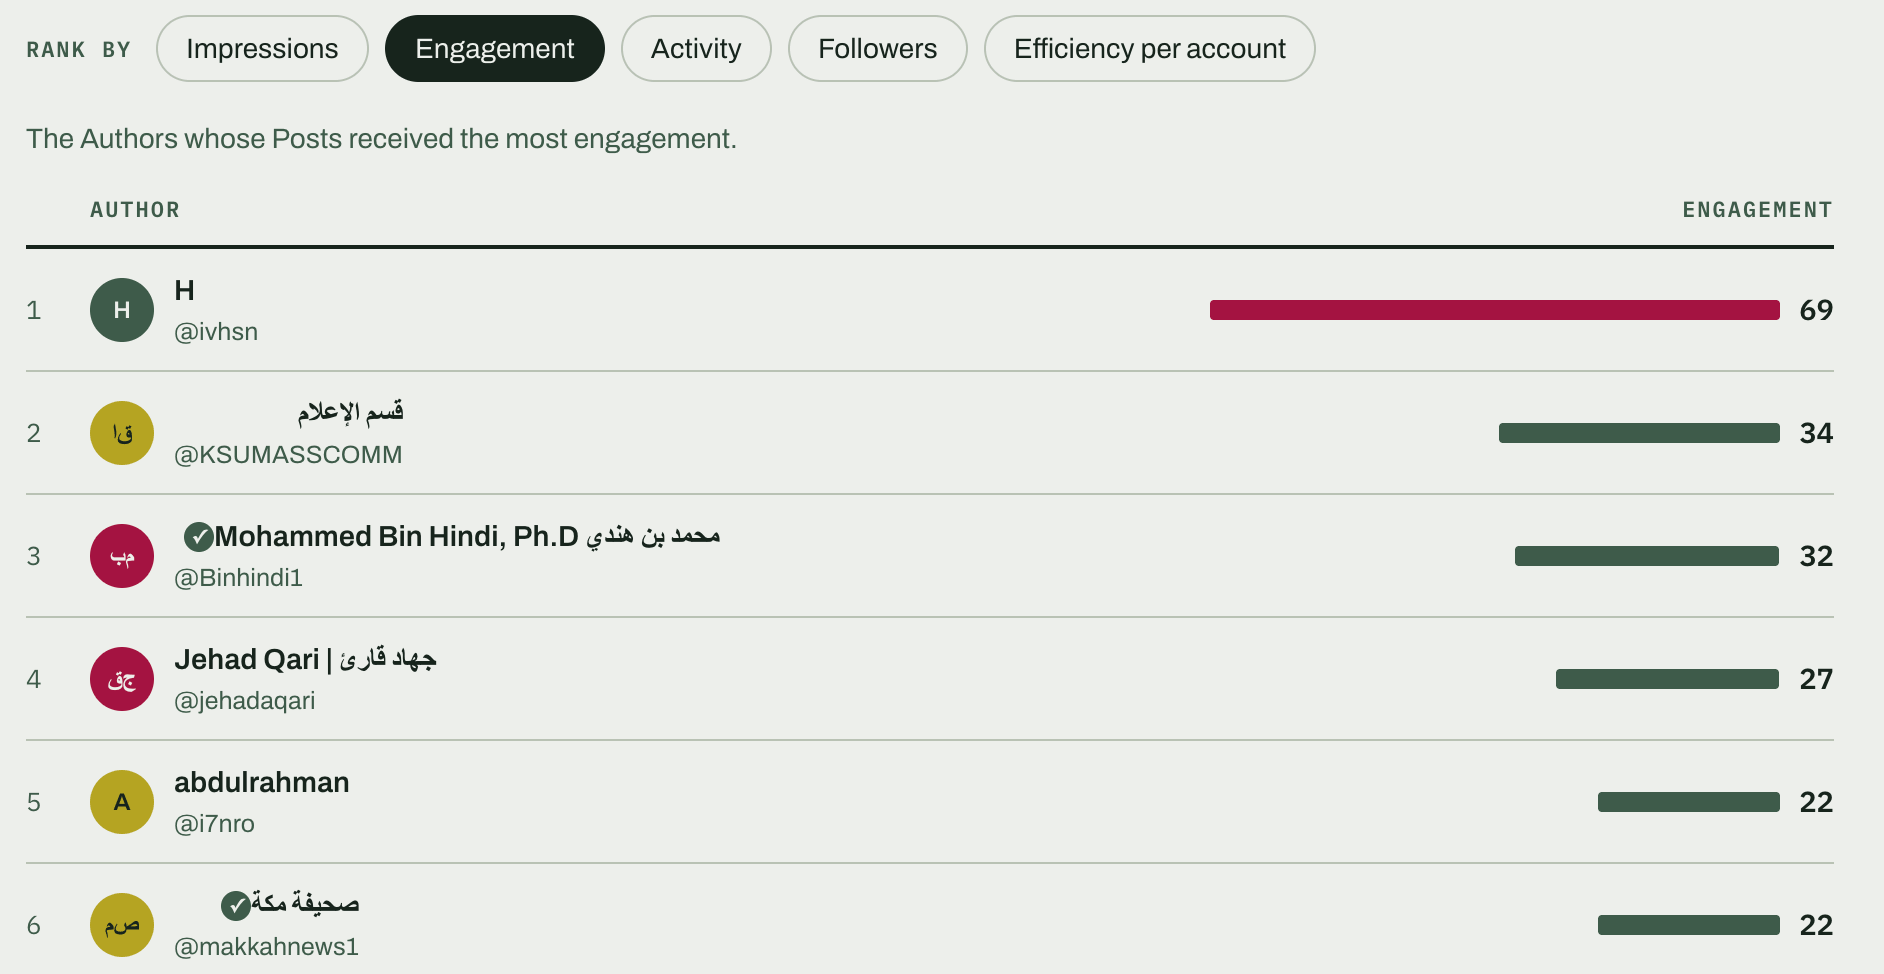
The back of the report holds what the front summarised: top accounts, top posts, breakdown by day, breakdown by language if it matters. Nobody reads it end to end, and that is fine. It exists so that a question has an answer.
Attach the rows as a file. The moment a client or a director doubts a figure, the difference between a report that survives and one that does not is whether you can show them the posts behind it within the minute.
Everything we gather stays within the Twitter compliance rules, and every report ships with the dataset behind it. See the plans or tell us what to measure.